SmartPeak Features
SmartPeak provides a plethora of features for analytical chemistry data processing. An incomplete set of features are described below.
Audit trail and data provenance
A complete record of all actions and data processing steps invoked by the user is often required in regulated environments. In addition, for debugging, it is useful to have a record of all actions the software has taken.
SmartPeak records all actions and data processing steps for audit trail and debugging purposes at two levels: 1) an application log, and 2) feature log.
Application log
The application log records all actions taken by SmartPeak during a user’s session.
The log is written to the user’s hard drive Path to logs and can also be viewed within the SmartPeak GUI view | logs.
Each action or line-item in the log is groups according to message type (e.g., INFO, DEBUG, WARNING, ERROR, etc.).
Feature log The feature log records all features that were found in a sample along with all changes that were made to each feature during a user’s session. Each feature change is time-stamped so that there is complete provenance of any reported data generated by SmartPeak. In addition, the feature log enables workflow checkpointing whereby a previously saved feature log for a particular sample can be loaded in a later session so that the user does not need to re-run a previously ran workflow for a sample. Feature logs are recorded during the STORE_FEATURES and can be loaded using the LOAD_FEATURES workflow steps. The used features can be visualized within the SmartPeak GUI using the various views provided. The pyOpenMS python module can be used for further post processing and analysis of features in python (see https://github.com/AutoFlowResearch/BFAIR for examples).
Automated data processing workflows and workflow execution engine
Data procesing workflow presets
SmartPeak has been used and optimized for various analytical chemistry workflows. An example set of optimized workflows have been given presets within SmartPeak for faster selection and execution.
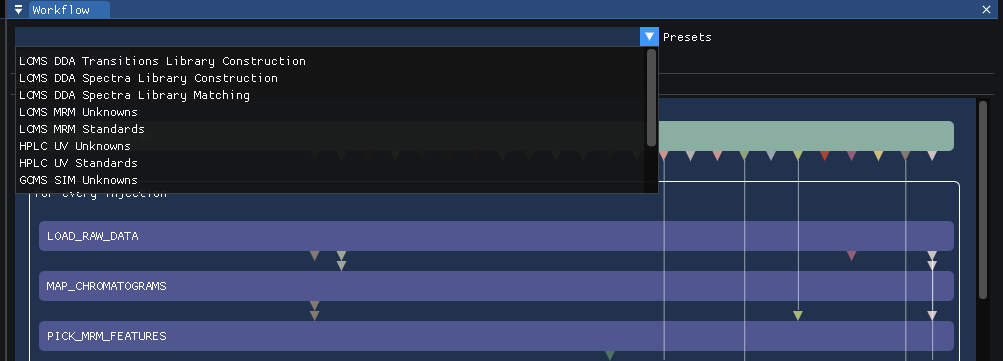
Please see tutorials for in depth walkthroughs for using each of the preset workflows. The workflow presets are also a good starting point for developing a custom workflow. Workflow steps can be added or removed using the GUI.

Modified workflows can be saved to a workflow.csv file and loaded into SmartPeak.
Workflow execution engine
SmartPeak includes a workflow engine that optimizes the order of workflow step executions and the resources used to process samples in parallel. Before any workflow is executed, SmartPeak determines which workflow steps can be executed in parallel and which need to be executed in serial by analyzing the workflow step dependencies.

The user has the option to specify the number of resources (i.e., CPU threads) that can be allocated to executing a workflow. By default, the maximum number of threads available to the user will be used. Once the order of workflow step executions and resources used to process samples in parallel are optimized, SmartPeak estimates the time needed to complete the workflow.

The time estimate is continuously updated as the workflow is executed to better reflect operating conditions.
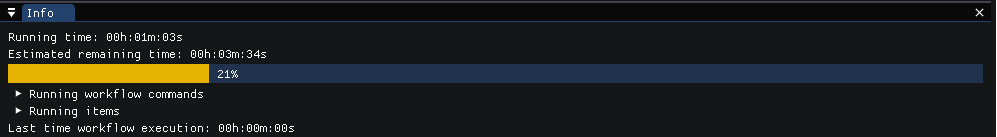
The actual workflow time is logged and also displayed in the GUI.

While the number of CPU cores/threads determines the number of samples that can be ran in parallel, it is important to note that the system memory (i.e., RAM) provides an upper limit on the number of samples that can be run during a single workflow. If you find that workflows are taking a long time, we recommend profiling the system memory to see if your computer is out of memory. Please see the FAQ for tips on how to improve system memory utilization for workflows involved large numbers of samples and large data files (e.g., non-targeted metabolomics).
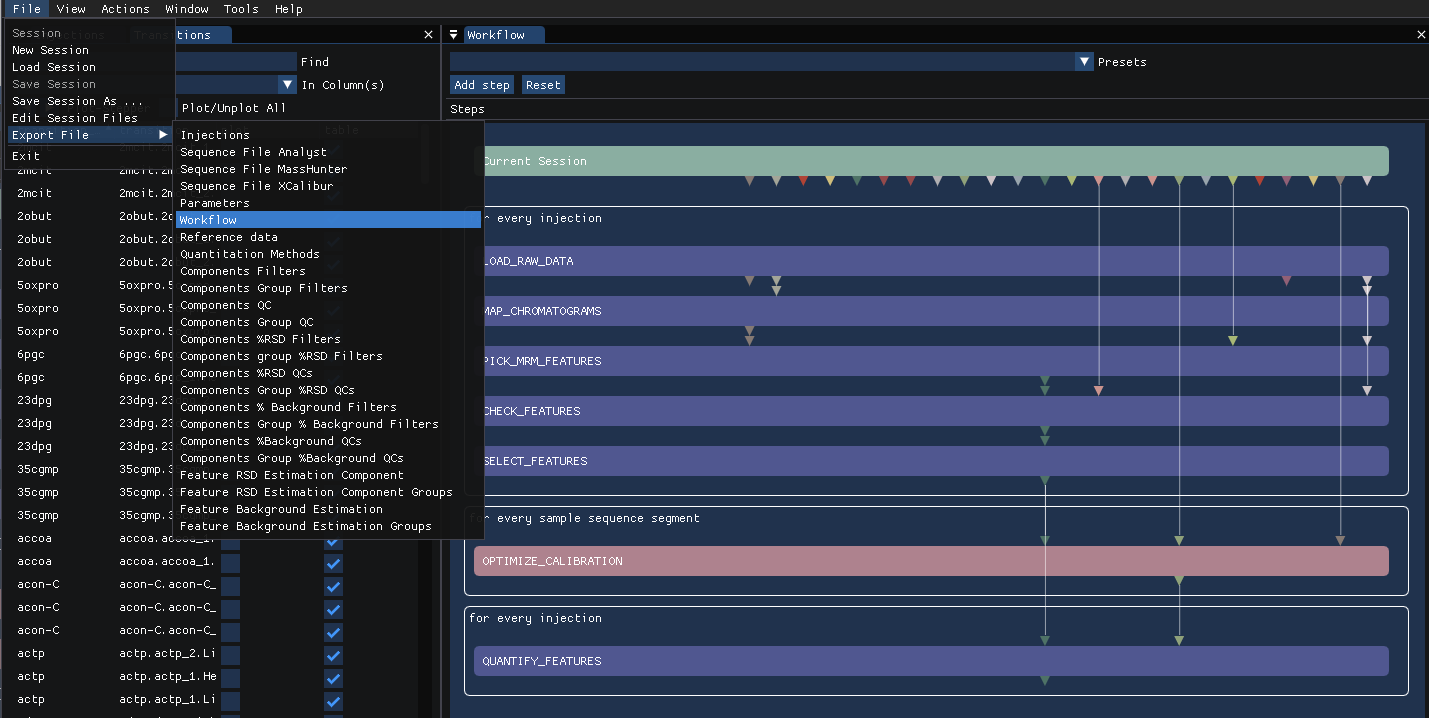
Workflow steps
All workflow steps are written in modern C++ so that workflows are as fast and safe as possible. Many of workflow steps that involve complex algorithms are wrappers around classes or functions that have been deposited in the open-source mass spectrometry library OpenMS an externally validated by the open-source community or scientific reviewers if the works were published in a peer-reviewed journal. SmartPeak integrates with the classes and functions natively so that workflows can be executed in memory without the need for expensive and time consuming disk IO. SmartPeak also provides logging, exception handling, and other facilities that would be expected of a professional application to ensure robust and reliable execution of open-source algorithms. A complete list of workflow steps and their description can be found in the FAQ. The SmartPeak team closely collaborates with the open-source community including with the developers at OpenMS, so if you have a workflow step request, please contact us.
Creating, saving, and loading sessions
Usage
A custom database is used by SmartPeak to store all SmartPeak application data, which is called the “session object”. The data includes user input, algorithm parameters, workflow steps, workflow step outputs, and UI settings. Certain user input and workflow step outputs are large (e.g., raw data files and feature files); SmartPeak does not store those directly, but stores the links to the files. This enables a user to share a relatively small session object with colleagues so that they can visualize the results of a SmartPeak workflow and interact with the SmartPeak UI just as the user had done when they saved the session. This also enables the user to re-run a workflow or further process a saved session from another computer so long as the computer has access to the files. Note that the user will be prompted to update the session file links if SmartPeak detects that the links are no longer valid prior to running any workflow that requires access to the session file data.
Example
After starting SmartPeak, create a new session by navigatin to file | new session.

A dialogue box to select the folder to load/save session files will be displayed.

Files that have been named using the SmartPeak convention will be identified automatically. The user can select alternative files as needed. The modal will alert the user if missing sessions files are identified.

The user can specify which files should be stored within the SmartPeak session object, and which remain external to the session object.

The user can save all application settings including the current UI view to the session object.

Optimize calibration curves and quantitation methods
Usage
SmartPeak provides algorithms and workflow steps for automatically optimizing calibration curves.
The user must first specify the quantitation method for each component to use for each transition and the amount of standards for each component in the Standards samples.
The QuantitationMethods.csv and StandardsConcentrations.csv files, respectively, are used for these purposes.
The user can optimize all calibration curves automatically using the workflow steps for OPTIMIZE_CALIBRATION and STORE_QUANTITATION_METHODS.
The user can then review all calibration curves in the GUI to further optimize the quantitation methods semi-manually.
Example
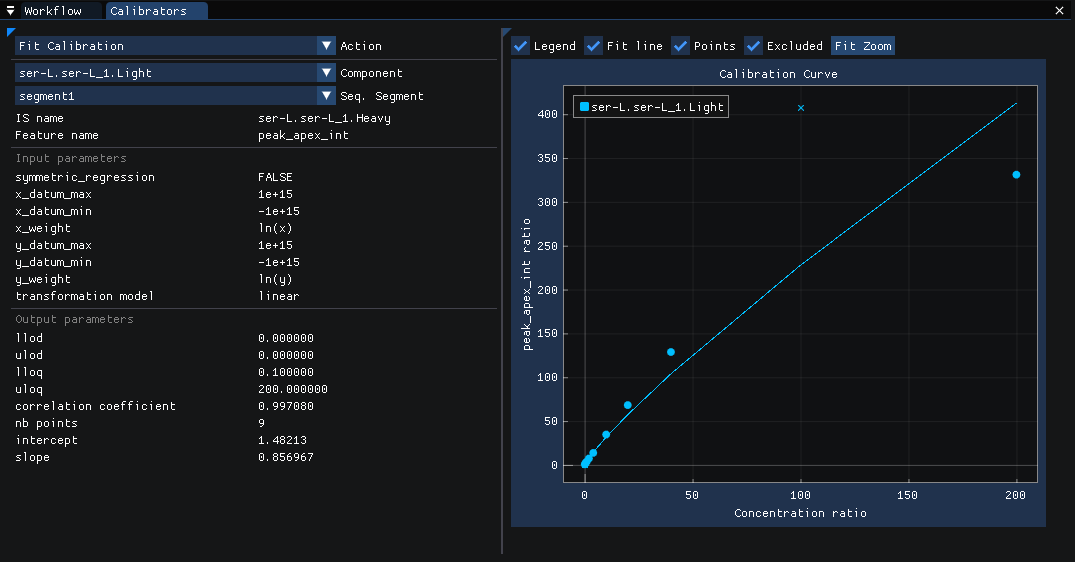
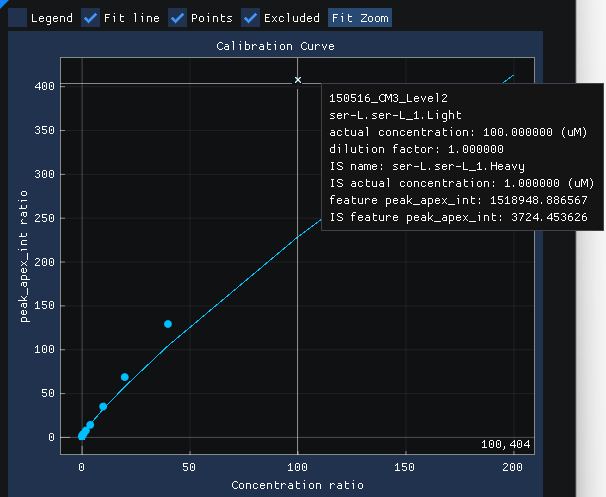
After running the workflow, the calibration curves for each quantitation method are available to view. The quantitation method parameters are shown on the left and the calibration curve and points are shown on the right. The user has the option to view different components and sequence segments using the menu on the top left. The user can also modify the quantitation method input parameters on the left.
Each point (i.e.., Injection) can be hovered over and a tooltip will display with additional information about that particular point
Each point can be right clicked to bring up a menu that allows for showing the chromatogram for the point or including/excluding the point from the calibration curve.
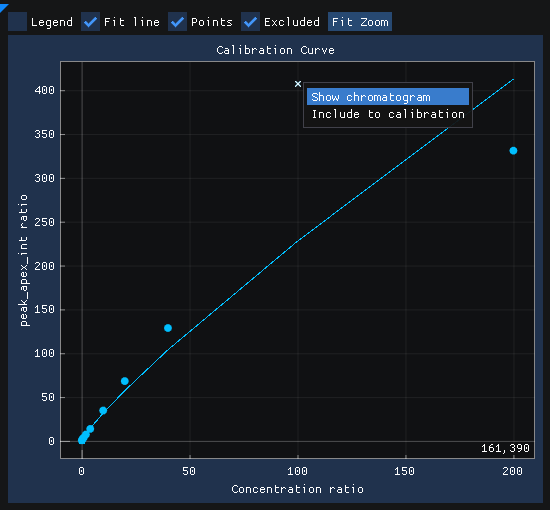
Selecting Show chromatogram brings up the chromatogram view for that point.

Selecting Exclude from calibration will remove the point from the calibration curve.
If Fit calibration is selected in the Actions menu of the Calibrators view, the quantitation method will be re-calculated without the point included.
If Optimize calibrations is selected in the Actions menu of the Calibrators view, the quantitation method will be re-optimized using the workflow step OPTIMIZE_CALIBRATION.

A tabular view of all quantitation methods can be found under View | Workflow parameters | Quantitation methods.

Select features from the “best” dilution
Usage
Due to the orders of magnitude difference between different metabolite, lipid, and protein species concentrations in biological samples, one often needs to run the same sample at different concentrations to capture all of the different species within the limits of detection for the instrument. After processing each of the different sample dilutions (referred to as dilution_factor in SmartPeak), the user often would like to select a specific dilution that a particular component should be reported because that dilution has been found to provide the best signal to noise ratio for that component.
SmartPeak allows to specify this selection as a step of the MERGE_INJECTIONS workflow step using the select_preferred_dilution parameter (false by default).
When select_preferred_dilution is set to true, SmartPeak will look for a file specified by a second parameter select_preferred_dilutions_file. This csv file will conatins the list of components and the corresponding preferred dilution:
component_name |
dilution_factor |
|---|---|
trp-L.trp-L_1.Heavy |
10 |
trp-L.trp-L_1.Light |
10 |
arg-L.arg-L_1.Heavy |
1 |
arg-L.arg-L_1.Light |
1 |
During the MERGE_INJECTIONS all components from the features that are listed in the file and to which the injection dilution does not correspond to the value set in the select_preferred_dilutions_file will be removed. The MERGE_INJECTIONS will be then applied as usual.
Example
Our sequence file is as follow (only relevant columns appear):
sample_name |
sample_group_name |
scan_polarity |
scan_mass_low |
scan_mass_high |
dilution_factor |
|---|---|---|---|---|---|
Lyubomir_Split_2_210914_4 |
Group1 |
positive |
-1 |
-1 |
10 |
Lyubomir_Split_2_210914_25 |
Group1 |
negative |
-1 |
-1 |
10 |
Lyubomir_Split_2_210914_5 |
Group1 |
positive |
-1 |
-1 |
1 |
Lyubomir_Split_2_210914_26 |
Group1 |
negative |
-1 |
-1 |
10 |
Lyubomir_Split_2_210914_6 |
Group1 |
positive |
-1 |
-1 |
1 |
Lyubomir_Split_2_210914_6 |
Group1 |
negative |
-1 |
-1 |
10 |
Please note that all our injections we want to select from are in the same group.
The parameters are set as follow in SmartPeak:
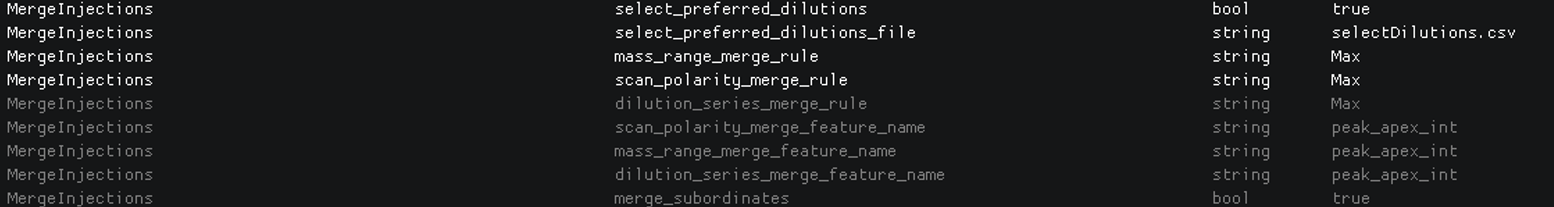
note that the mass_range_merge_rule, dilution_series_merge_rule and scan_polarity_merge_rule as been set to Max in our example, but you can set to another value. These rules will be applied after having explcuding the features that do not correspond to our preference.
The dilution file is as follow:
component_name |
dilution_factor |
|---|---|
trp-L.trp-L_1.Heavy |
10 |
trp-L.trp-L_1.Light |
10 |
arg-L.arg-L_1.Heavy |
1 |
arg-L.arg-L_1.Light |
1 |
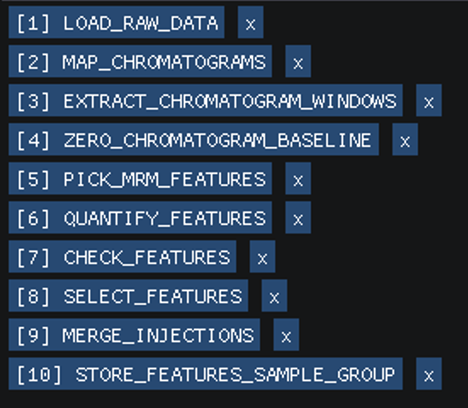
The workflow will be:
Once the workflow has been run, We will export the Group Pivot Table:

The result is then:
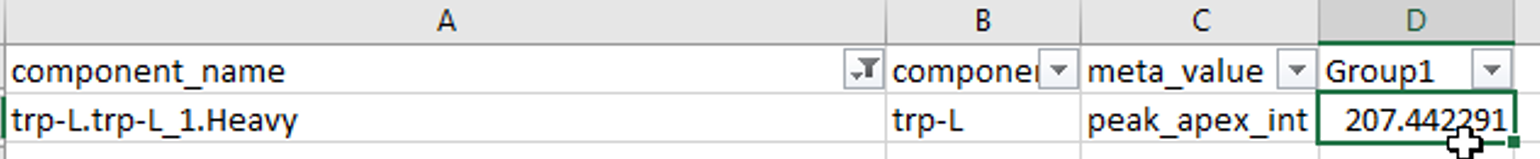
The value for peak_apex_int is 207.
Indeed the feature database willl show us that it is the maximum peak_apex_int from the sample based on dilution 10.

Now, in our dilution file, if we set trp-L.trp-L_1.Heavy to preferred dilution_factor 1, the result will be 137, which is the maximum peak_apex_int from the sample based on dilution 1.
Optimize workflow step algorithm parameters
Usage
The algorithms behind each workflow step can be optimized and fine-tuned for each particular use case.
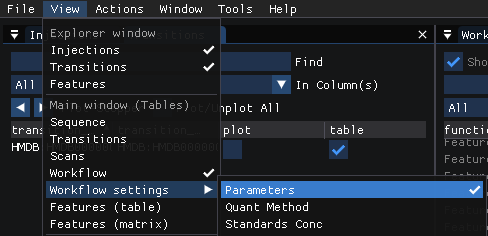
The parameters used in a workflow can be viewed and modified through View | Workflow settings | Parameters.
The parameters that have been specified by the user are shown in white, defaults not set by the user are shown in grey, and unused paramters are shown in blue. Hovering over the name of the parameter displays a tooltip that provides a brief explanation of what the paramter does.

Examples of optimized parameters for different acquisition methods are provided in the tutorials.
Example 1: Debug feature finding, selection, and filtering
The first part of developing an automated data processing method is to optimize the feature finding, selection, and filtering paramters.
We recommend using the bulk statistics in View | Statistics and visualizations provided in View | Chromatograms to gain intuition about how each of the parameter changes affect feature finding, selection, and filtering.
We also recommend using the feature reports in Actions | Report and exporting the long (Feature DB) or matrix (Feature Table) formats to get a more fine-grained view of how each of the parameter changes affect feature finding, selection, and filtering.
Feature Finding
The feature finding step entails (optionally) smoothing and integrating the features (also called peaks or convex hulls) in 2D (e.g., XIC chromatogram of intensity vs time or XIC spectrum of time vs m/z) or 3D (e.g., intensity vs time vs m/z).
Note that multiple features are found in any given chromatogram or spectrum.
Additional steps including baseline normalizing, windowing, etc. are available to preprocess the data before running the feature finding step.
For single reaction monitoring (SRM/MRM) or data independent (DIA) methods, the MRMFeatureFinderScoring functions are the ones to be manipulated.
For data dependent (DDA) or full scan methods, the FeatureFindingMetabo, ElutionPeakDetection, MassTraceDetection functions are the ones to be manipulated.
Check that all features are being found and properly integrated prior to moving on to Feature Selection!
Feature Selection The feature selection step entails aligning the retention time of features and selecting the most probable feature. Feature alignment is one of the biggest bottlenecks in targeted and non-targeted chromatography-based mass spectrometry. SmartPeak provides an advanced feature alignment algorithm that is based on relative retention time instead of absolute retention time to allow for accurate feature alignment even when retention time shifts of several minutes occur. For single reaction monitoring (SRM/MRM) or data independent (DIA) methods, the ``MRMFeatureSelector.schedule_MRMFeatures_qmip` functions are the ones to be manipulated. Check that all features are being properly selected prior to moving on to Feature Filtering!
Feature Filtering
The feature filtering step removes features from a chromatogram or spectrum based on user specified criteria.
Feature filtering can be performed before or after feature selection.
The feature filters are specified in the ComponentGroupFilters.csv and ComponentFilters.csv files for filtering at the ComponentGroup (TransitionGroup in SRM) and Component (Tansition in SRM) levels, respectively.
It is our experience that if the feature finding and selection parameters have been well optimized, the feature filtering step is not needed.
However, there are use cases where there are only a few components (transitions in SRM) that make optimal feature selection difficult, and feature filtering can come in handy.
Example 2: Debug automated QC/QA of workflows
The next part of developing an automated data processing method is to optimize the QC/QA reporting metrics.
We recommend using the feature reports in Actions | Report and exporting the long (Feature DB) or matrix (Feature Table) formats after checking QC_transition_message, QC_transition_score, QC_transition_group_message, and QC_transition_group_score to get a more fine-grained view of how each of the parameter changes affect feature finding, selection, and filtering.
Feature QC
The feature QC step flags features from a chromatogram or spectrum based on user specified criteria (same algorithm and similar format to Feature Filtering above).
Feature QC can be performed at anytime during a data processing workflow.
The feature QCs are specified in the ComponentGroupQCs.csv and ComponentQCss.csv files for QC/QA at the ComponentGroup (TransitionGroup in SRM) and Component (Tansition in SRM) levels, respectively.